Log
A log in API AutoFlow is a chronological record that captures events, actions, or messages generated by a API AutoFlow (system), or it’s components. It serves as a valuable tool for monitoring, troubleshooting, and auditing purposes.
Logs can contain various types of information, such as:
- System Events: Logs can record important system events, including system startups and shutdowns, failures, and error messages.
- Application Events: Application logs capture events specific to a particular process from the configuration, such as errors, warnings, informational messages, user actions, and other relevant activities.
- Security Events: Security logs track security-related events, such as login attempts, access control violations, system breaches, and suspicious activities, which help in detecting and investigating security incidents.
- Performance Metrics: Performance monitoring, providing metrics related to resource usage, response times, transaction logs, and other performance indicators. These logs are crucial for identifying performance bottlenecks and optimizing system performance.
- Audit Trails: Audit logs maintain a record of activities and changes made within a system, including user actions, configuration modifications, file access, database transactions, and administrative activities. Audit logs are often used for compliance purposes and to investigate potential policy violations.
Where are the logs stored?
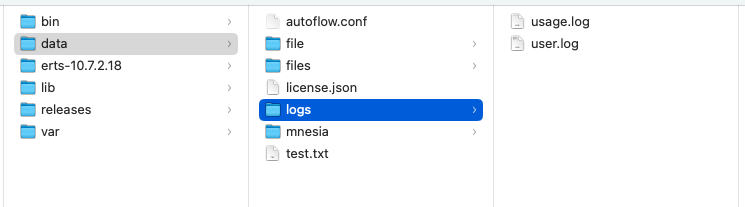
Logs are stored in text-based files in the /interactor/data/logs folder.
By default, there are two files. Each log entry includes relevant information such as timestamps, event descriptions, error codes, source identifiers, and other contextual details.
- user.log: Store the user generated logs
- usage.log: Stores the usage
How to access the logs?
Log management and analysis tools are commonly used to parse, aggregate, search, and visualize log data. They enable administrators and developers identify issues, track system behavior, troubleshoot problems, and improve system performance and security.
API AutoFlow provides a flexible way to access the logs
Download Logs

From the right panel, press the Download Logs button to download the logs
Access the file
Access the file directly from the logs folder
Use File Action for automation
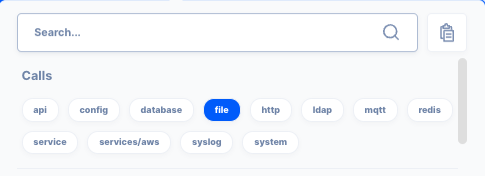
Create a workflow to extract logs using file/read action.
WARNING: It is important to note that logs can consume a significant amount of disk space. Therefore, log rotation and retention policies are often implemented to manage the storage and archive of logs over time.
What does the log capture?
Logs capture the beginning and end data of an action. For instance, when a log is enabled for an action, both the input data and the resulting data will be recorded.
Capturing the logs
There are several ways logs can be captured.
Server Log

Service Log

Operation Log
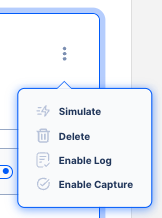
Operation logs can be enabled from the server or service details page list view kebab button.
Action Log
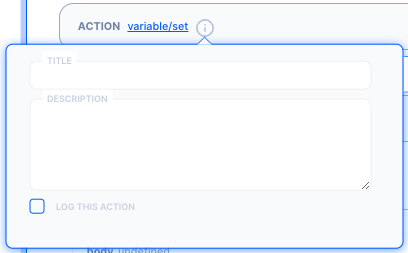
Action logs can be enabled from the actions’s information modal.
System/Log Action
The log action can be placed anywhere in the workflow to capture the data at that moment of the data flow.
Log Levels

- debug
- info
- warning
- error